Monitoring
For users who wish to monitor or check the functionality of their validator node, we will provide helpful tips. If you require a more robust user interface(WebUI) or wish to monitor not only the status but also the performance of your validator node, we will introduce a dedicated way for that purpose.
Just like with any other server, it's beneficial to monitor error logs on the validator node. Please be aware that ERROR[07-26|05:32:01.016] Snapshot extension registration failed is often output, but this is not a cause for concern. Exclude this log from your alert emission targets.
Monitoring Tips
We believe the most straightforward and reliable way to determine whether a Validator Node is operating properly is by monitoring if the node correctly accumulates blocks at 15-second intervals.
The process of accepting/creating blocks is the end result of complex tasks performed by the validator node. If the blocks are being created regularly, it indicates that all other complex tasks are functioning properly as well.
Firstly, we will demonstrate how to check the block height. Along with this, we will cover other topics that appear to be useful for monitoring. The use case highly depends on your specific situation.
How to Check Block Height
Blocks are generated at 15-second intervals. If no block is created for over a minute, it might be worth raising an alert.
# via Command Line Interface (CLI)
$ geth attach --exec 'eth.blockNumber' ipc:/home/geth/.ethereum/geth.ipc

# via RPC
$ curl http://127.0.0.1:8545/ \
    -H 'Content-Type: application/json' \
    -d '{"jsonrpc":"2.0", "method":"eth_blockNumber", "params":[], "id":1}'
How to check if the Validator Node is catching up with the latest block
# via Command Line Interface (CLI)
$ geth attach --exec 'eth.syncing' ipc:/home/geth/.ethereum/geth.ipc
# You should expect `false` as the output.

# via RPC
$ curl http://127.0.0.1:8545/ \
    -H 'Content-Type: application/json' \
    -d '{"jsonrpc":"2.0", "method":"eth_syncing", "params":[], "id":1}'
# If you are properly synchronized, you should see an output similar to the following:
{
    currentBlock: 4504031,
    highestBlock: 4660759,
    knownStates: 31357681,
    pulledStates: 31357680,
    startingBlock: 4504031
}
How to Check if the Validator Node is Running in Mining Mode
# via Command Line Interface (CLI)
$ geth attach --exec 'eth.mining' ipc:/home/geth/.ethereum/geth.ipc
# You should expect `true` as the output.

# via RPC
$ curl http://127.0.0.1:8545/ \
    -H 'Content-Type: application/json' \
    -d '{"jsonrpc":"2.0", "method":"eth_mining", "params":[], "id":1}'
How Many Peers Are You Connected To?
# via Command Line Interface (CLI)
$ geth attach --exec 'admin.peers.length' ipc:/home/geth/.ethereum/geth.ipc
How to Check Slashing Status?
Slashing occurs when your node is down. As long as your node operates normally, which can be checked via block height monitoring, slashing should not be a concern.
Please refer to FAQ for further details.
Monitoring Metrics With Rich Web UI
Validator nodes can output metrics to monitor their status and performance. The output metrics are raw data, so we're providing a method to visualize them with a rich UI using InfluxDB and Grafana. Primarily, please follow the two links below for setup instructions.
We'll demonstrate how to view these metrics using a rich web UI with InfluxDB and Grafana. Please refer to the links below for basic instructions:
- Geth Docs: Monitoring Geth with InfluxDB and Grafana
- Ethereum Docs: MONITORING GETH WITH INFLUXDB AND GRAFANA
Additionally, we provide an illustrative guide. We believe the following steps will make your setup process easier. However, please note that these instructions may be outdated.
Setup(Docker)
InfluxDB
Run InfluxDB
Run the InfluxDB container according to Install InfluxDB.
Create a new directory to store your data in and navigate into the directory.
mkdir path/to/influxdb-docker-data-volume && cd $_
Run InfluxDB container
docker run \
  --name influxdb \
  -d \
  -p 8086:8086 \
  --volume $PWD:/var/lib/influxdb2 \
  influxdb:2.6.1
And you can access InfluxDB through localhost:8086.
Create User and Database(GUI)
To store data from geth, you must create a user and database(InfluxDB calls this bucket) at InfluxDB.
If you can access localhost:8086 from a browser, you can create a user and database.
For details, refer to InfluxDB setup.
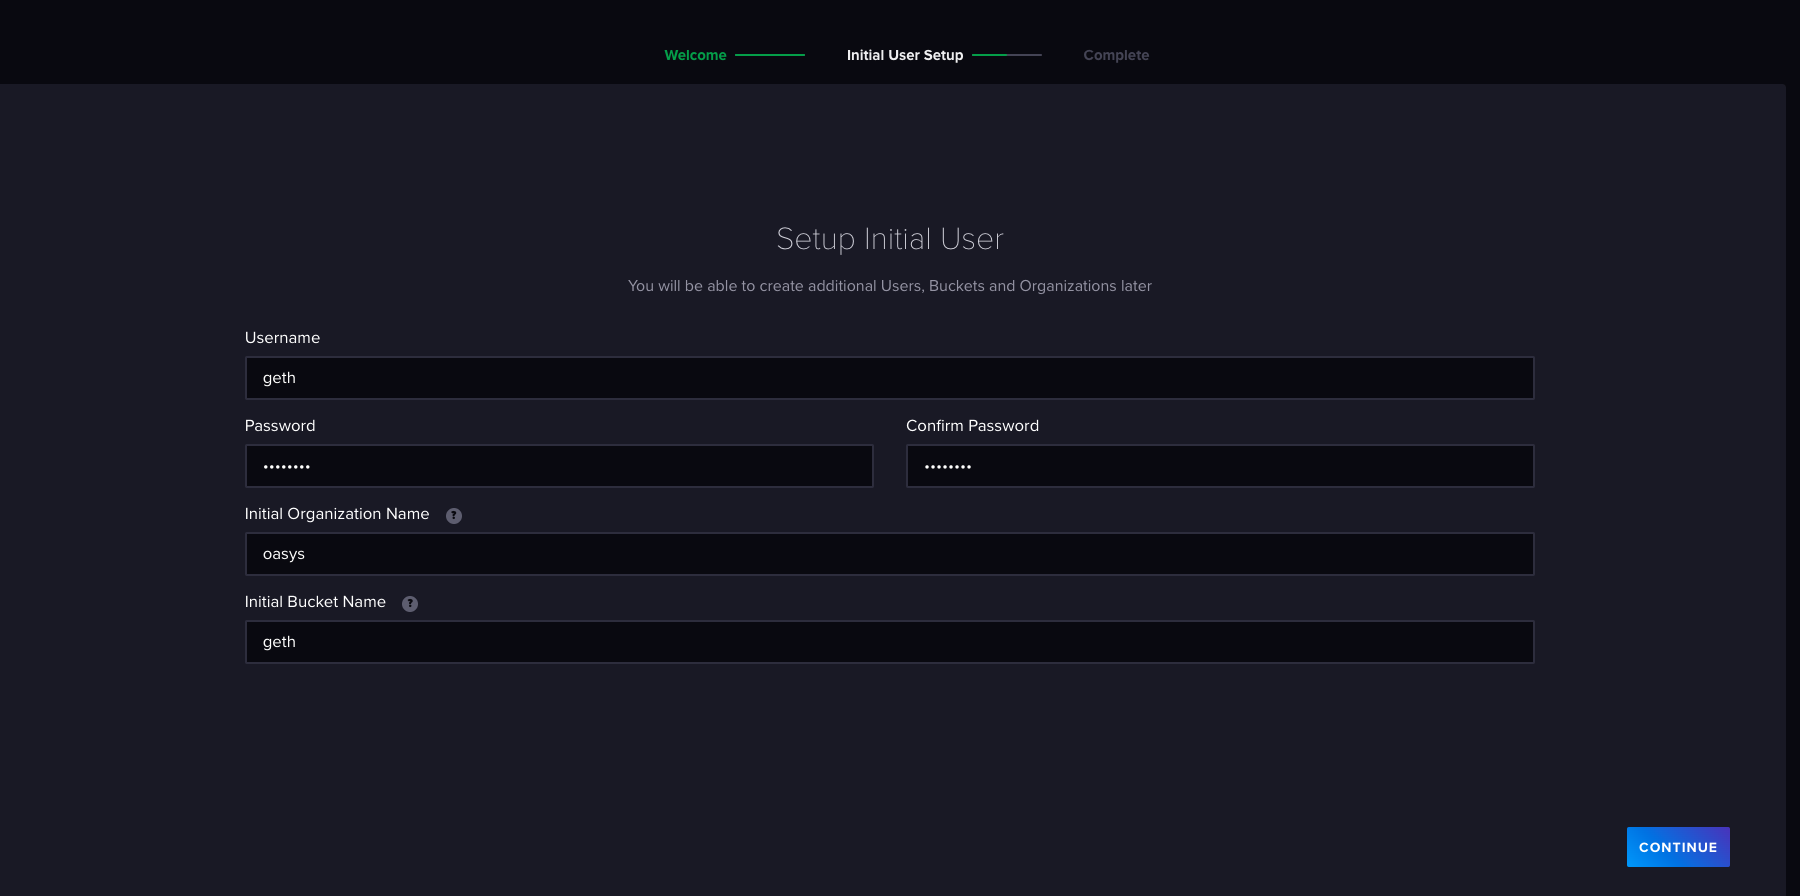
Please sign in at http//localhost:8086 with the following setting.
| Username | geth |
| Password | The password you want to set |
| Bucket(Database) | geth |
| Organization | oasys |
Create User and Database(CLI)
To store data from geth, you must create a user and database(InfluxDB calls this bucket) at InfluxDB.
If you cannot access localhost:8086 from a browser, you can create a user and database through the InfluxDB-CLI.
For details, refer to InfluxDB setup.
# enter to container
docker exec -it influxdb /bin/bash
# In container
influx setup \
  --username geth \
  --password <PASSWORD_YOU_WANT_TO_SET> \
  --bucket geth \
  --org oasys
Check Your Access Token(GUI)
You can check access token by requesting http://localhost:8086/api/v2/authorizations.
It is requirement to have created user and bucket in GUI according to Create User and Database(GUI)
You can check access token at authorizations.token
{
	"links": {
		"self": "/api/v2/authorizations"
	},
	"authorizations": [
		{
			"id": "0ab6d312c0215000",
			"token": "-tlSotd95mli4EAEy6pT0potClJL6gE4Zfvph3lgK9koMuwcKRiKo7yLpAze9Zxxf-gfp07bWX-xMgKkb2JogA==",
...
Check Your Access Token(CLI)
You can view access token by InfluxDB-CLI.
# enter to container
docker exec -it influxdb /bin/bash
# In container
influx auth list
Save your access token to use with Grafana.
Geth
Please execute the following command to allow geth to store metrics in InfluxDB.
geth --metrics --metrics.influxdb --metrics.influxdb.endpoint "http://0.0.0.0:8086" --metrics.influxdb.username "geth" --metrics.influxdb.password <YOUR_PASSWORD>
Grafana
Run Grafana
Please run grafana container by following command.
docker run -d --name=grafana -p 3000:3000 grafana/grafana
Allow accessing InfluxDB(InfluxQL)
You can access Grafana through localhost:3000.
You can access a visualization dashboard. The browser will prompt for login credentials (user: admin and password: admin). When prompted, the default password should be changed and saved.
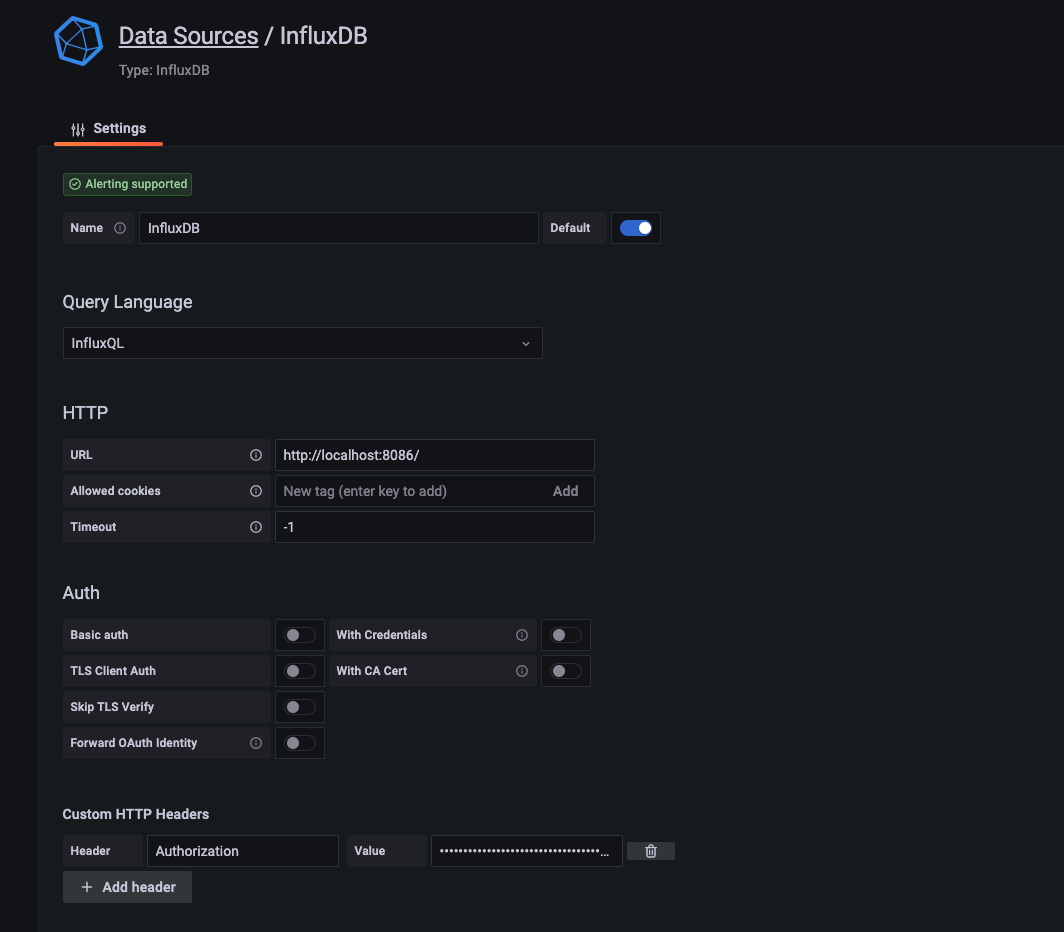
To set InfluxDB as the data source, click on the Data sources icon and click on InfluxDB.
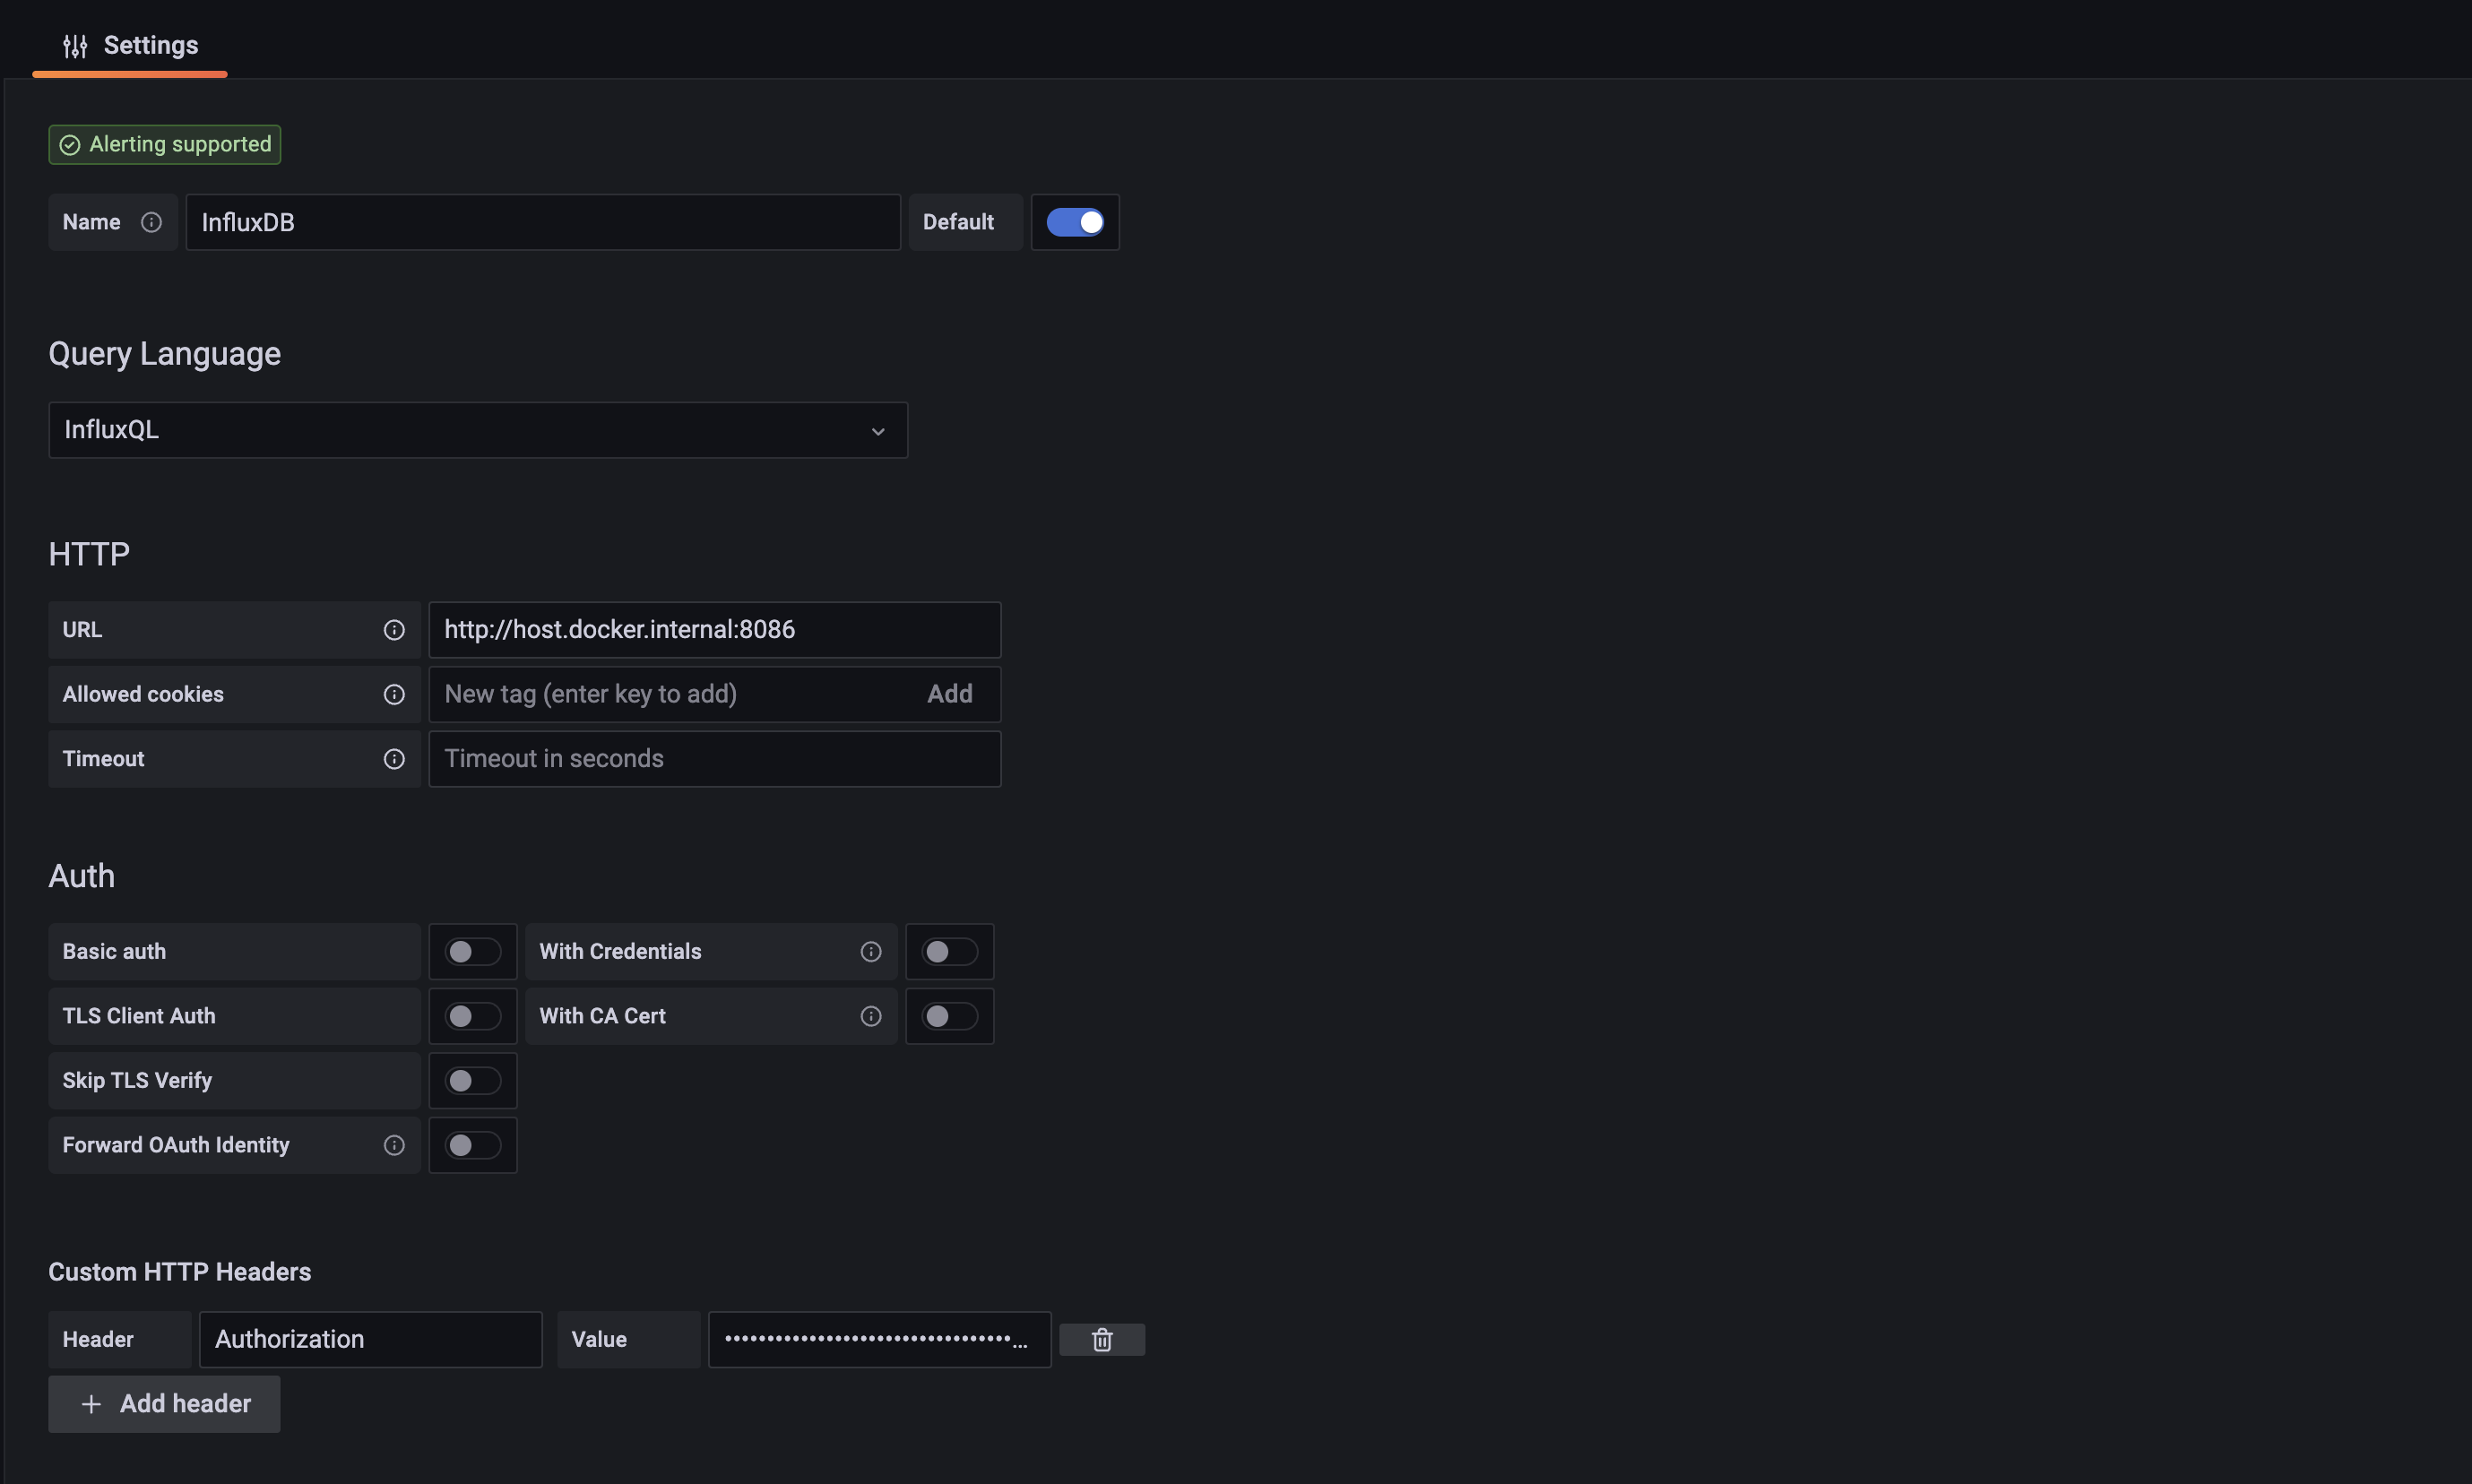
Please set The following configuration.
Name: InfluxDB
Query Language: InfluxQL
HTTP:
URL: http://host.docker.internal:8086
Access: Server (default)
Whitelisted cookies: None (leave blank)
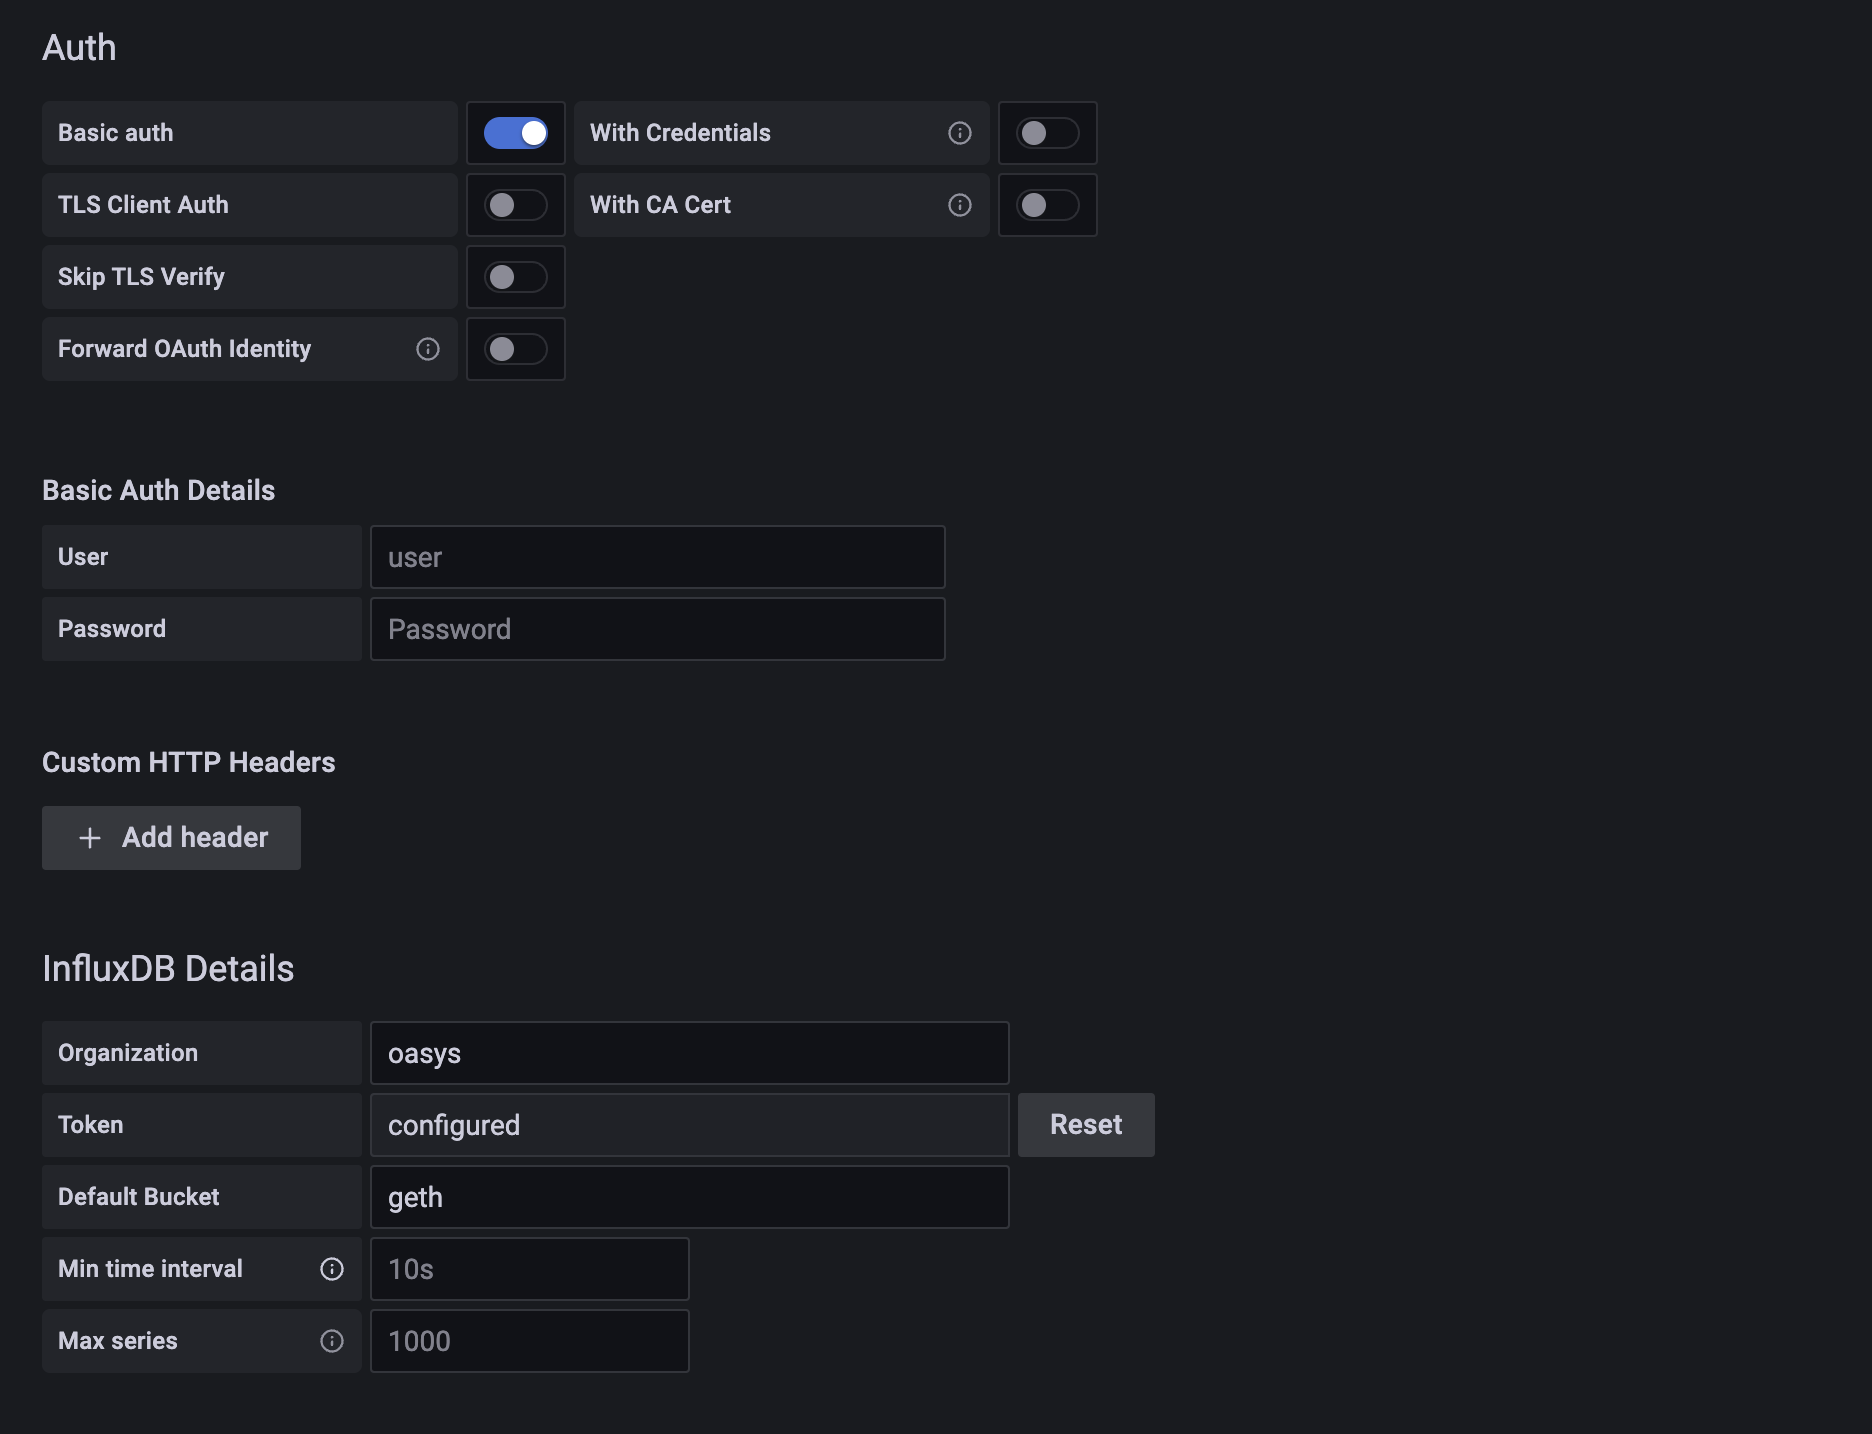
Auth:
All options left as their default (switches off)
Custom HTTP Headers:
- Heder: Authorization
Value: Token <YOUR_ACCESS_TOKEN> # There is a space between 'Token' and <YOUR_ACCESS_TOKEN>
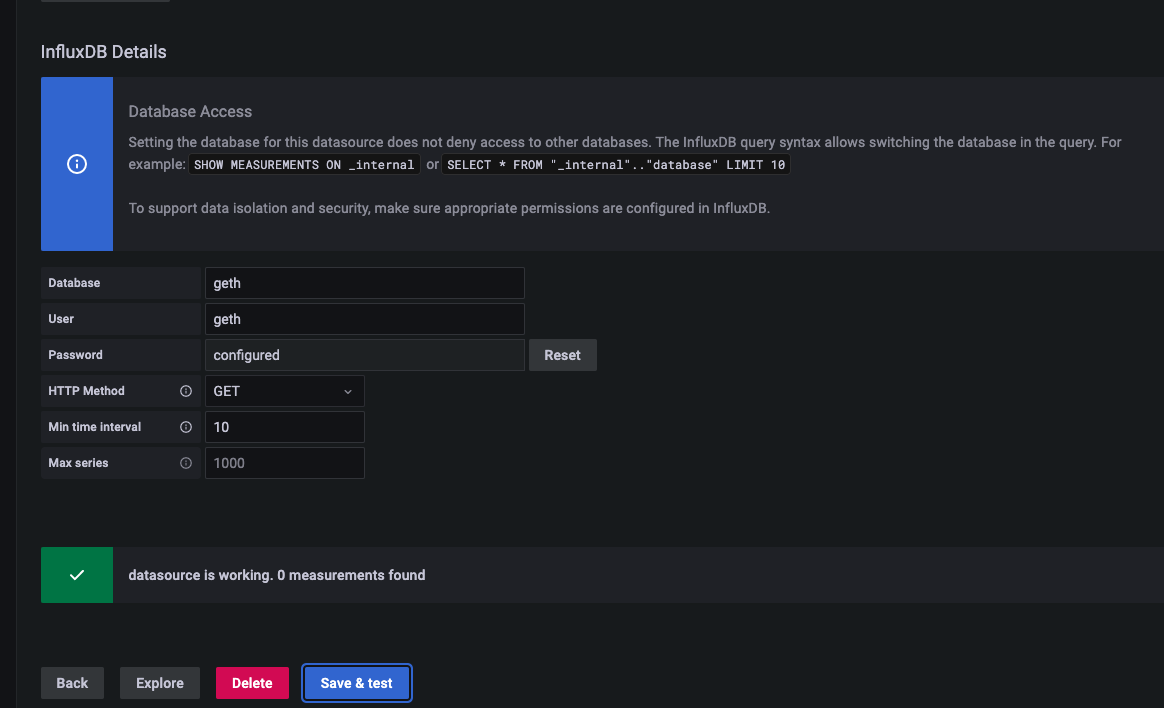
InfluxDB Details:
Database: geth
User: geth
Password: <your-password>
HTTP Method: GET
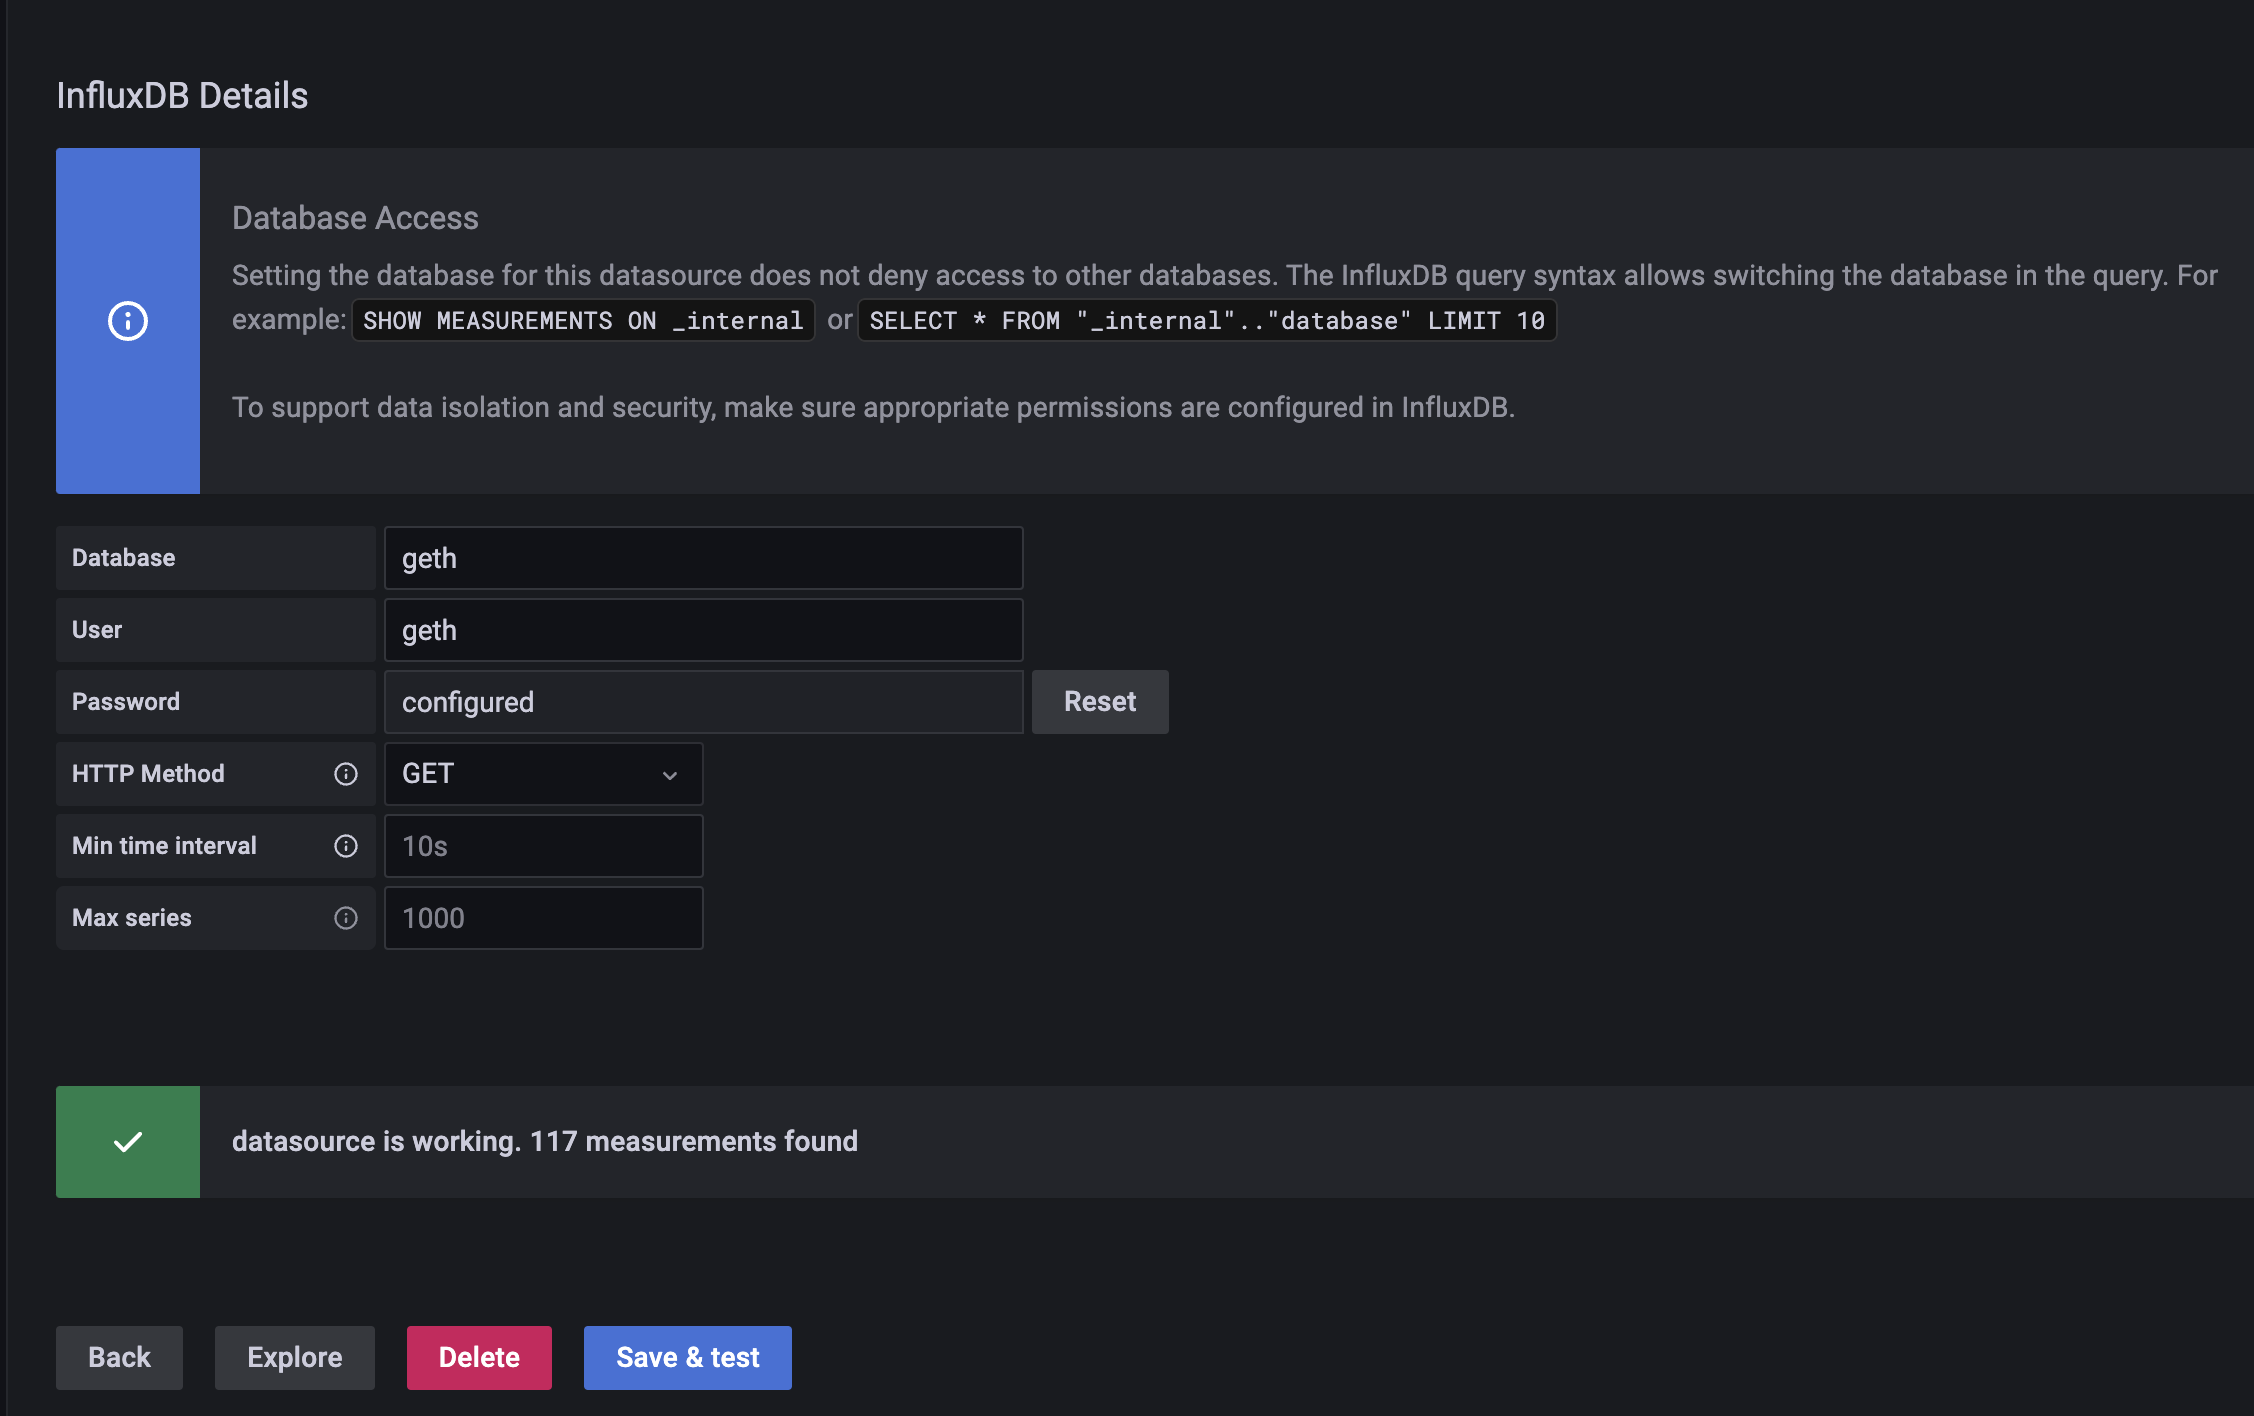
Click on Save and test and wait for the confirmation to pop up.
For details, refer to InfluxDB docs.
Allow accessing InfluxDB(Flux)
You can access Grafana through localhost:3000.
You can access a visualization dashboard. The browser will prompt for login credentials (user: admin and password: admin). When prompted, the default password should be changed and saved.
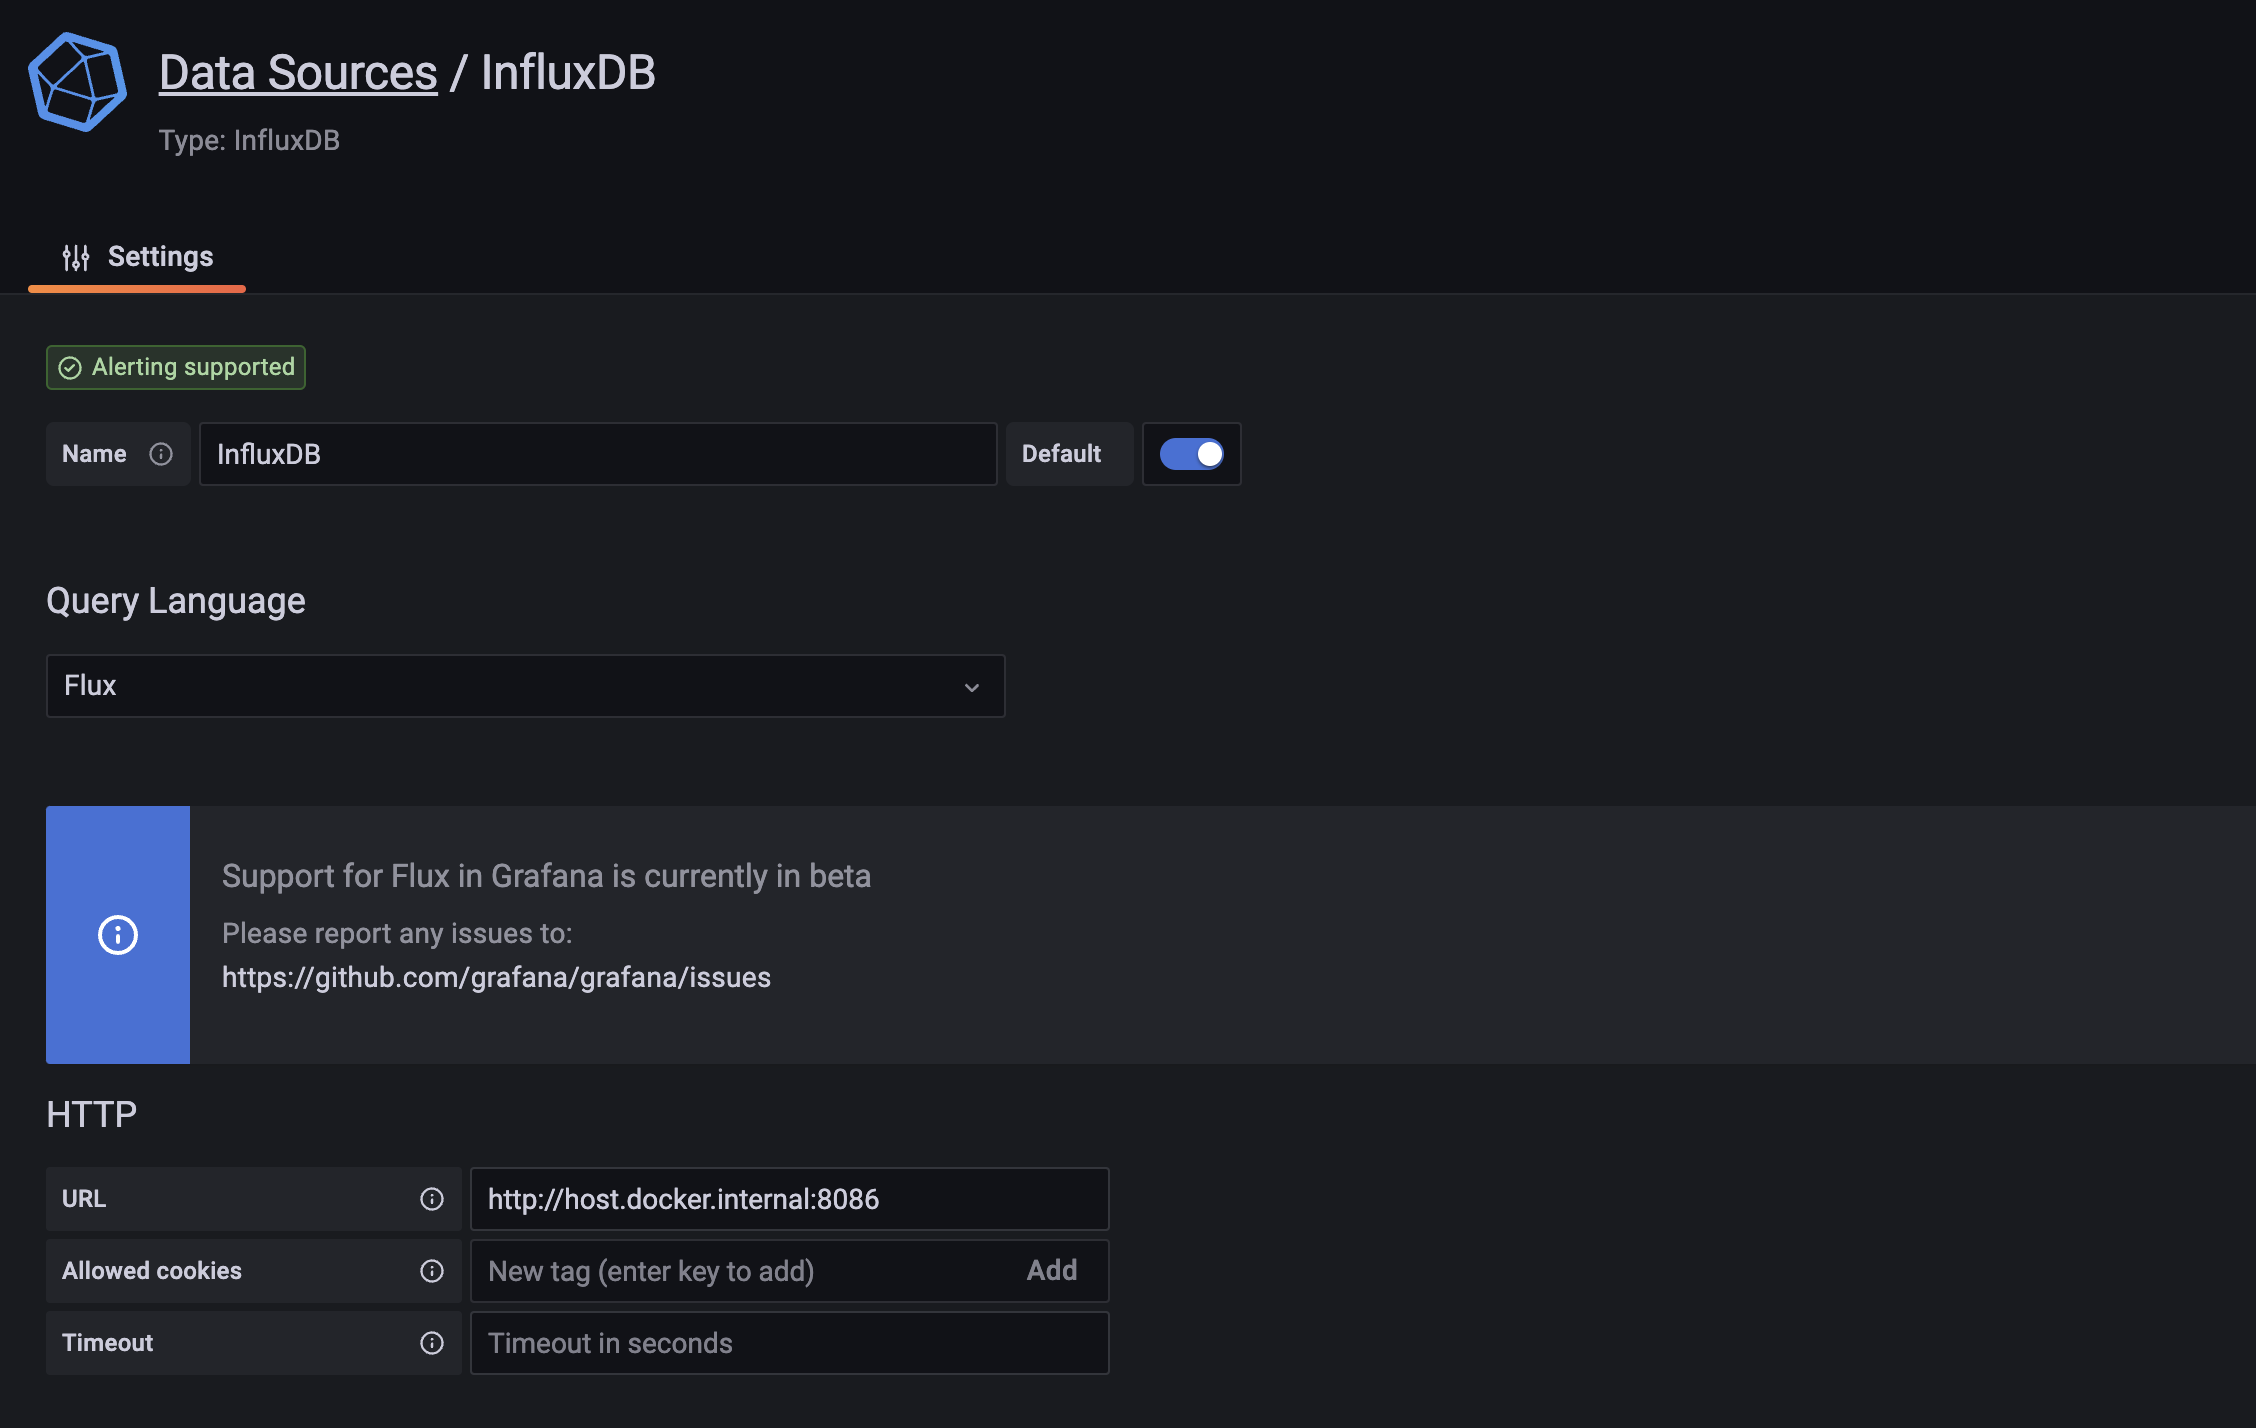
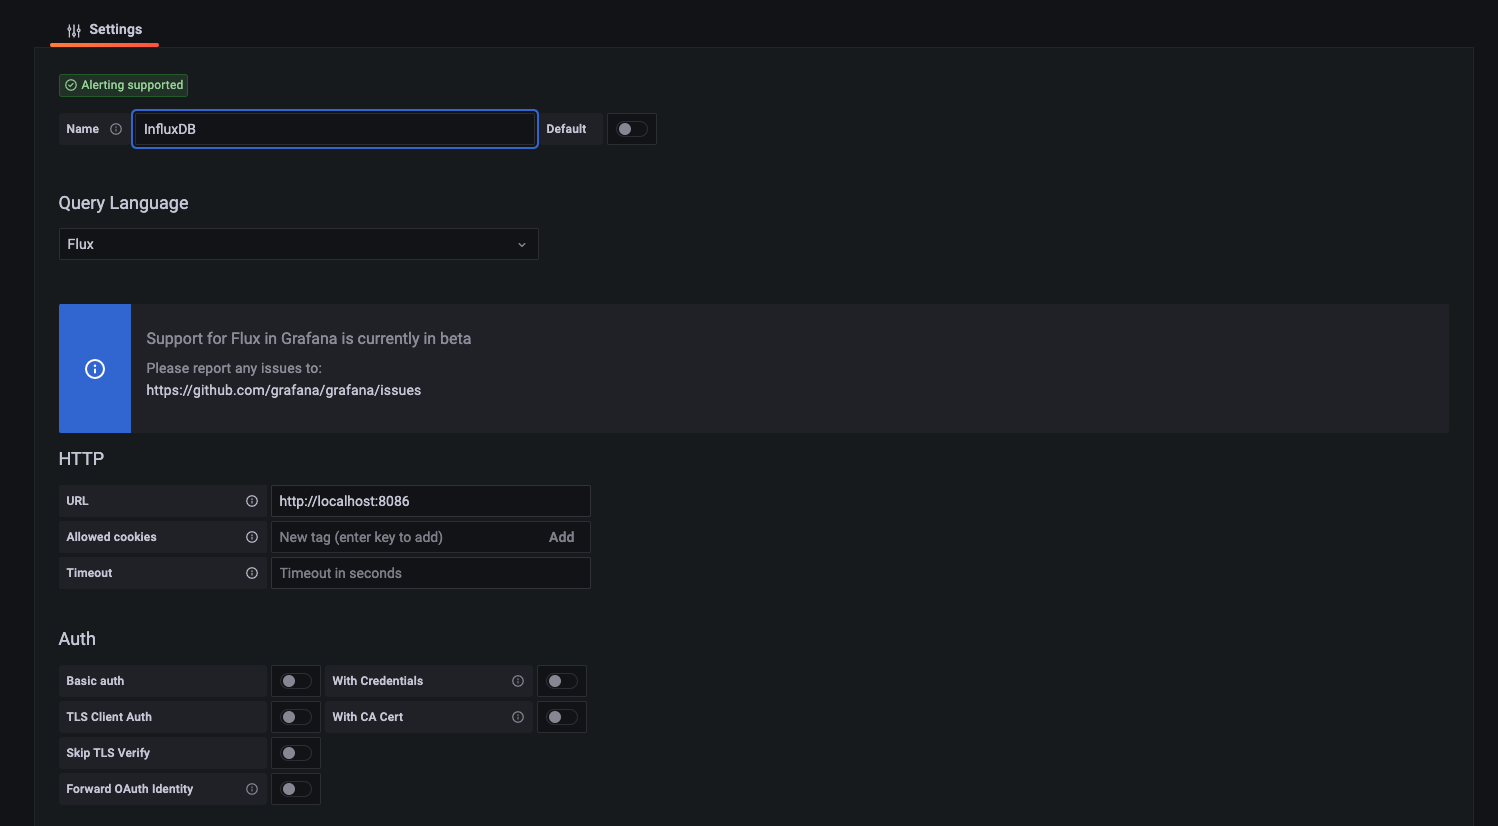
To set InfluxDB as the data source, click on the Data sources icon and click on InfluxDB.
Please set The following configuration.
Name: InfluxDB
Query Language: Flux
HTTP:
URL: http://host.docker.internal:8086
Access: Server (default)
Whitelisted cookies: None (leave blank)
Auth:
All options left as their default (switches off)
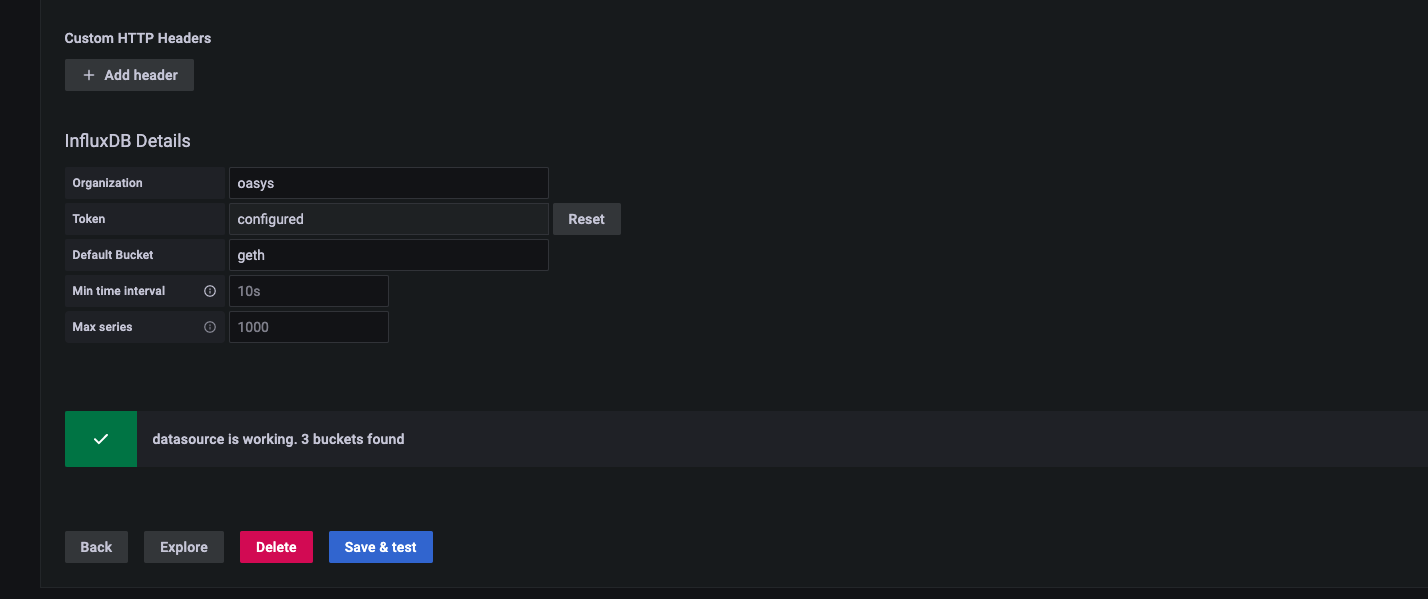
Custom HTTP Headers:
None
InfluxDB Details
Organization: oasys
Token: <your-access-token>
Default Bucket: geth
Click on Save and test and wait for the confirmation to pop up.
For details, refer to InfluxDB docs.
Setup Dashboard
For a Geth monitoring dashboard, copy the ID of this dashboard and paste it into the Import page in Grafana. After saving the dashboard, you should be able to view it.
Customize Dashboard
If you want to customize the dashboard, please refer to Ethereum docs.
Setup(Without Docker)
InfluxDB
Install
Please install InfluxDB and InfluxDB-CLI on the install page.
Build InfluxDB
Please start InfluxDB by using the following command
influxd
And you can access InfluxDB through localhost:8086.
Create User and Database(GUI)
To store data from geth, you must create a user and database(InfluxDB calls this bucket) at InfluxDB.
If you can access localhost:8086 from a browser, you can create a user and database.
For details, refer to InfluxDB setup.
Please sign in at http//localhost:8086 with the following setting.
| Username | geth |
| Password | The password you want to set |
| Bucket(Database) | geth |
| Organization | oasys |
Create User and Database(CLI)
To store data from geth, you must create a user and database(InfluxDB calls this bucket) at InfluxDB.
If you cannot access localhost:8086 from a browser, you can create a user and database through the InfluxDB-CLI.
For details, refer to InfluxDB setup.
influx setup \
  --username geth \
  --password <PASSWORD_YOU_WANT_TO_SET> \
  --bucket geth \
  --org oasys
Check Your Access Token
InfluxDB data is stored in ~/.influxdbv2.
And you can check your access token with the following command.
cat ~/.influxdbv2/configs
[default]
  url = "http://localhost:8086"
  token = "GAKFGBrM4..." # Access Token
  org = "oasys"
  active = true
Save your access token to use with Grafana.
Geth
Please execute the following command to allow geth to store metrics in InfluxDB.
geth --metrics --metrics.influxdb --metrics.influxdb.endpoint "http://0.0.0.0:8086" --metrics.influxdb.username "geth" --metrics.influxdb.password <YOUR_PASSWORD>
Grafana
Install
Please install Grafana on the install page.
Build Grafana
You will find the startup commands on the install page of each environment, so please use them to start Grafana.
Allow accessing InfluxDB(InfluxQL)
You can access Grafana through localhost:3000.
You can access a visualization dashboard. The browser will prompt for login credentials (user: admin and password: admin). When prompted, the default password should be changed and saved.
To set InfluxDB as the data source, click on the Data sources icon and click on InfluxDB.
Please set The following configuration.
Name: InfluxDB
Query Language: InfluxQL
HTTP:
  URL: http://localhost:8086
  Access: Server (default)
  Whitelisted cookies: None (leave blank)
Auth:
  All options left as their default (switches off)
Custom HTTP Headers:
  - Heder: Authorization
    Value: Token <YOUR_ACCESS_TOKEN> # There is a space between 'Token' and <YOUR_ACCESS_TOKEN>
InfluxDB Details:
  Database: geth
  User: geth
  Password: <your-password>
  HTTP Method: GET
Click on Save and test and wait for the confirmation to pop up.
For details, refer to InfluxDB docs.
Allow accessing InfluxDB(Flux)
You can access Grafana through localhost:3000.
You can access a visualization dashboard. The browser will prompt for login credentials (user: admin and password: admin). When prompted, the default password should be changed and saved.
To set InfluxDB as the data source, click on the Data sources icon and click on InfluxDB.
Please set The following configuration.
Name: InfluxDB
Query Language: Flux
HTTP:
  URL: http://localhost:8086
  Access: Server (default)
  Whitelisted cookies: None (leave blank)
Auth:
  All options left as their default (switches off)
Custom HTTP Headers:
  None
InfluxDB Details
  Organization: oasys
  Token: <your-access-token>
  Default Bucket: geth
Click on Save and test and wait for the confirmation to pop up.
For details, refer to InfluxDB docs.
Setup Dashboard
For a Geth monitoring dashboard, copy the ID of this dashboard and paste it into the Import page in Grafana. After saving the dashboard, you should be able to view it.
Customize Dashboard
If you want to customize the dashboard, please refer to Ethereum docs.
Checklist(optional)
Checking Geth Sync
You can check if your geth synchronizes the other geth by checking Latest block.
If Latest block increases by four in one minute, your geth is working.
Checking Disk
Since geth needs to store data on the disk, you need to make sure there is enough storage space.